PRODUCTHEAD: A primer on analytics for beginners
PRODUCTHEAD is a regular newsletter of product management goodness,
curated by Jock Busuttil.
product lag: 2+2=5
tl;dr
You can only tell if you’ve been successful if you can measure it
Analytics approaches that work for others may not work in your context
Behind every metrics is a behaviour
The point of an experiment is to learn
a favour: please share this with other product people
every PRODUCTHEAD edition is online for you to refer back to
hello
Analytics can seem daunting to an outsider. There’s plenty of impenetrable jargon for the beginner to contend with, such as conversion, segments and cohorts. And the emphasis on numbers and large amounts of data may seem overwhelming if you don’t consider yourself to be particularly mathematical.
Analytics, whether of the performance of your website, app or software, is an important part of the overall quest of product managers to figure out what our users really need to do, and how well our product helps them to do that.
Start with the question #
When starting out with analytics, people find they are faced with one of two problems: having no data, or having too much data. There are so many things that our data could be telling us, and this can be overwhelming.
Rather than gazing into a vast sea of data and hoping that patterns and insights will spring out at you, your starting point should instead be the question you’re trying to answer. Once that is clear, you can figure out which of your available data will help you to answer the question, and which data you’ll need to start gathering.
Where does data come from? #
Data is simply another name for information. Almost everything these days generates data. When you view a website, it keeps a log of which pages you access and when. When you make a phone call, your phone and your carrier keep a record of who you called, and for how long. When you use an app, it might keep a count of which actions you performed and when you did them.

The problem is that data by itself lacks meaning. Without analysis to find the patterns, and interpretation to infer what those patterns may mean, it’s difficult for us to do anything useful. Analytics is really about examining data, finding patterns and ascribing meaning to those patterns. Once we have extracted the meaning, we can decide what we do next with it.
What and why #
Imagine that you’re trying to figure out what’s going on with something. Naturally you’re going to ask what’s happening; you’ll probably also want to know why it’s happening.
Web or app analytics give us only one part of the picture: generally speaking, analytics can tell us what our users are doing, but not why they’re doing it. We call this type of analysis quantitative because the numbers tell us how many — the quantity — of our users are doing something.
When we ask why our users are doing something, we are interested in the qualities of the things they’re doing, so we call this type of analysis qualitative. If we went and chatted with 10 people and asked them why they enjoyed eating ice cream, they may give us all sorts of answers. Qualitative analysis would help us to make sense of this type of data.
Conversion funnels #
So let’s say we’ve built an app. We hope and expect that users will download the app to their phone, create a new account with us, and start using the app. Ideally, they use the app at least once a day, and keep using it for at least 6 months.
In a perfect world, every single user that downloads the app will go through all the stages and keep using the app forever. In reality, it’s usual for some proportion of the users to drop out and not continue to the next stage in the process. This is often referred to as the conversion funnel because the top of the funnel is wider than the spout at the bottom.
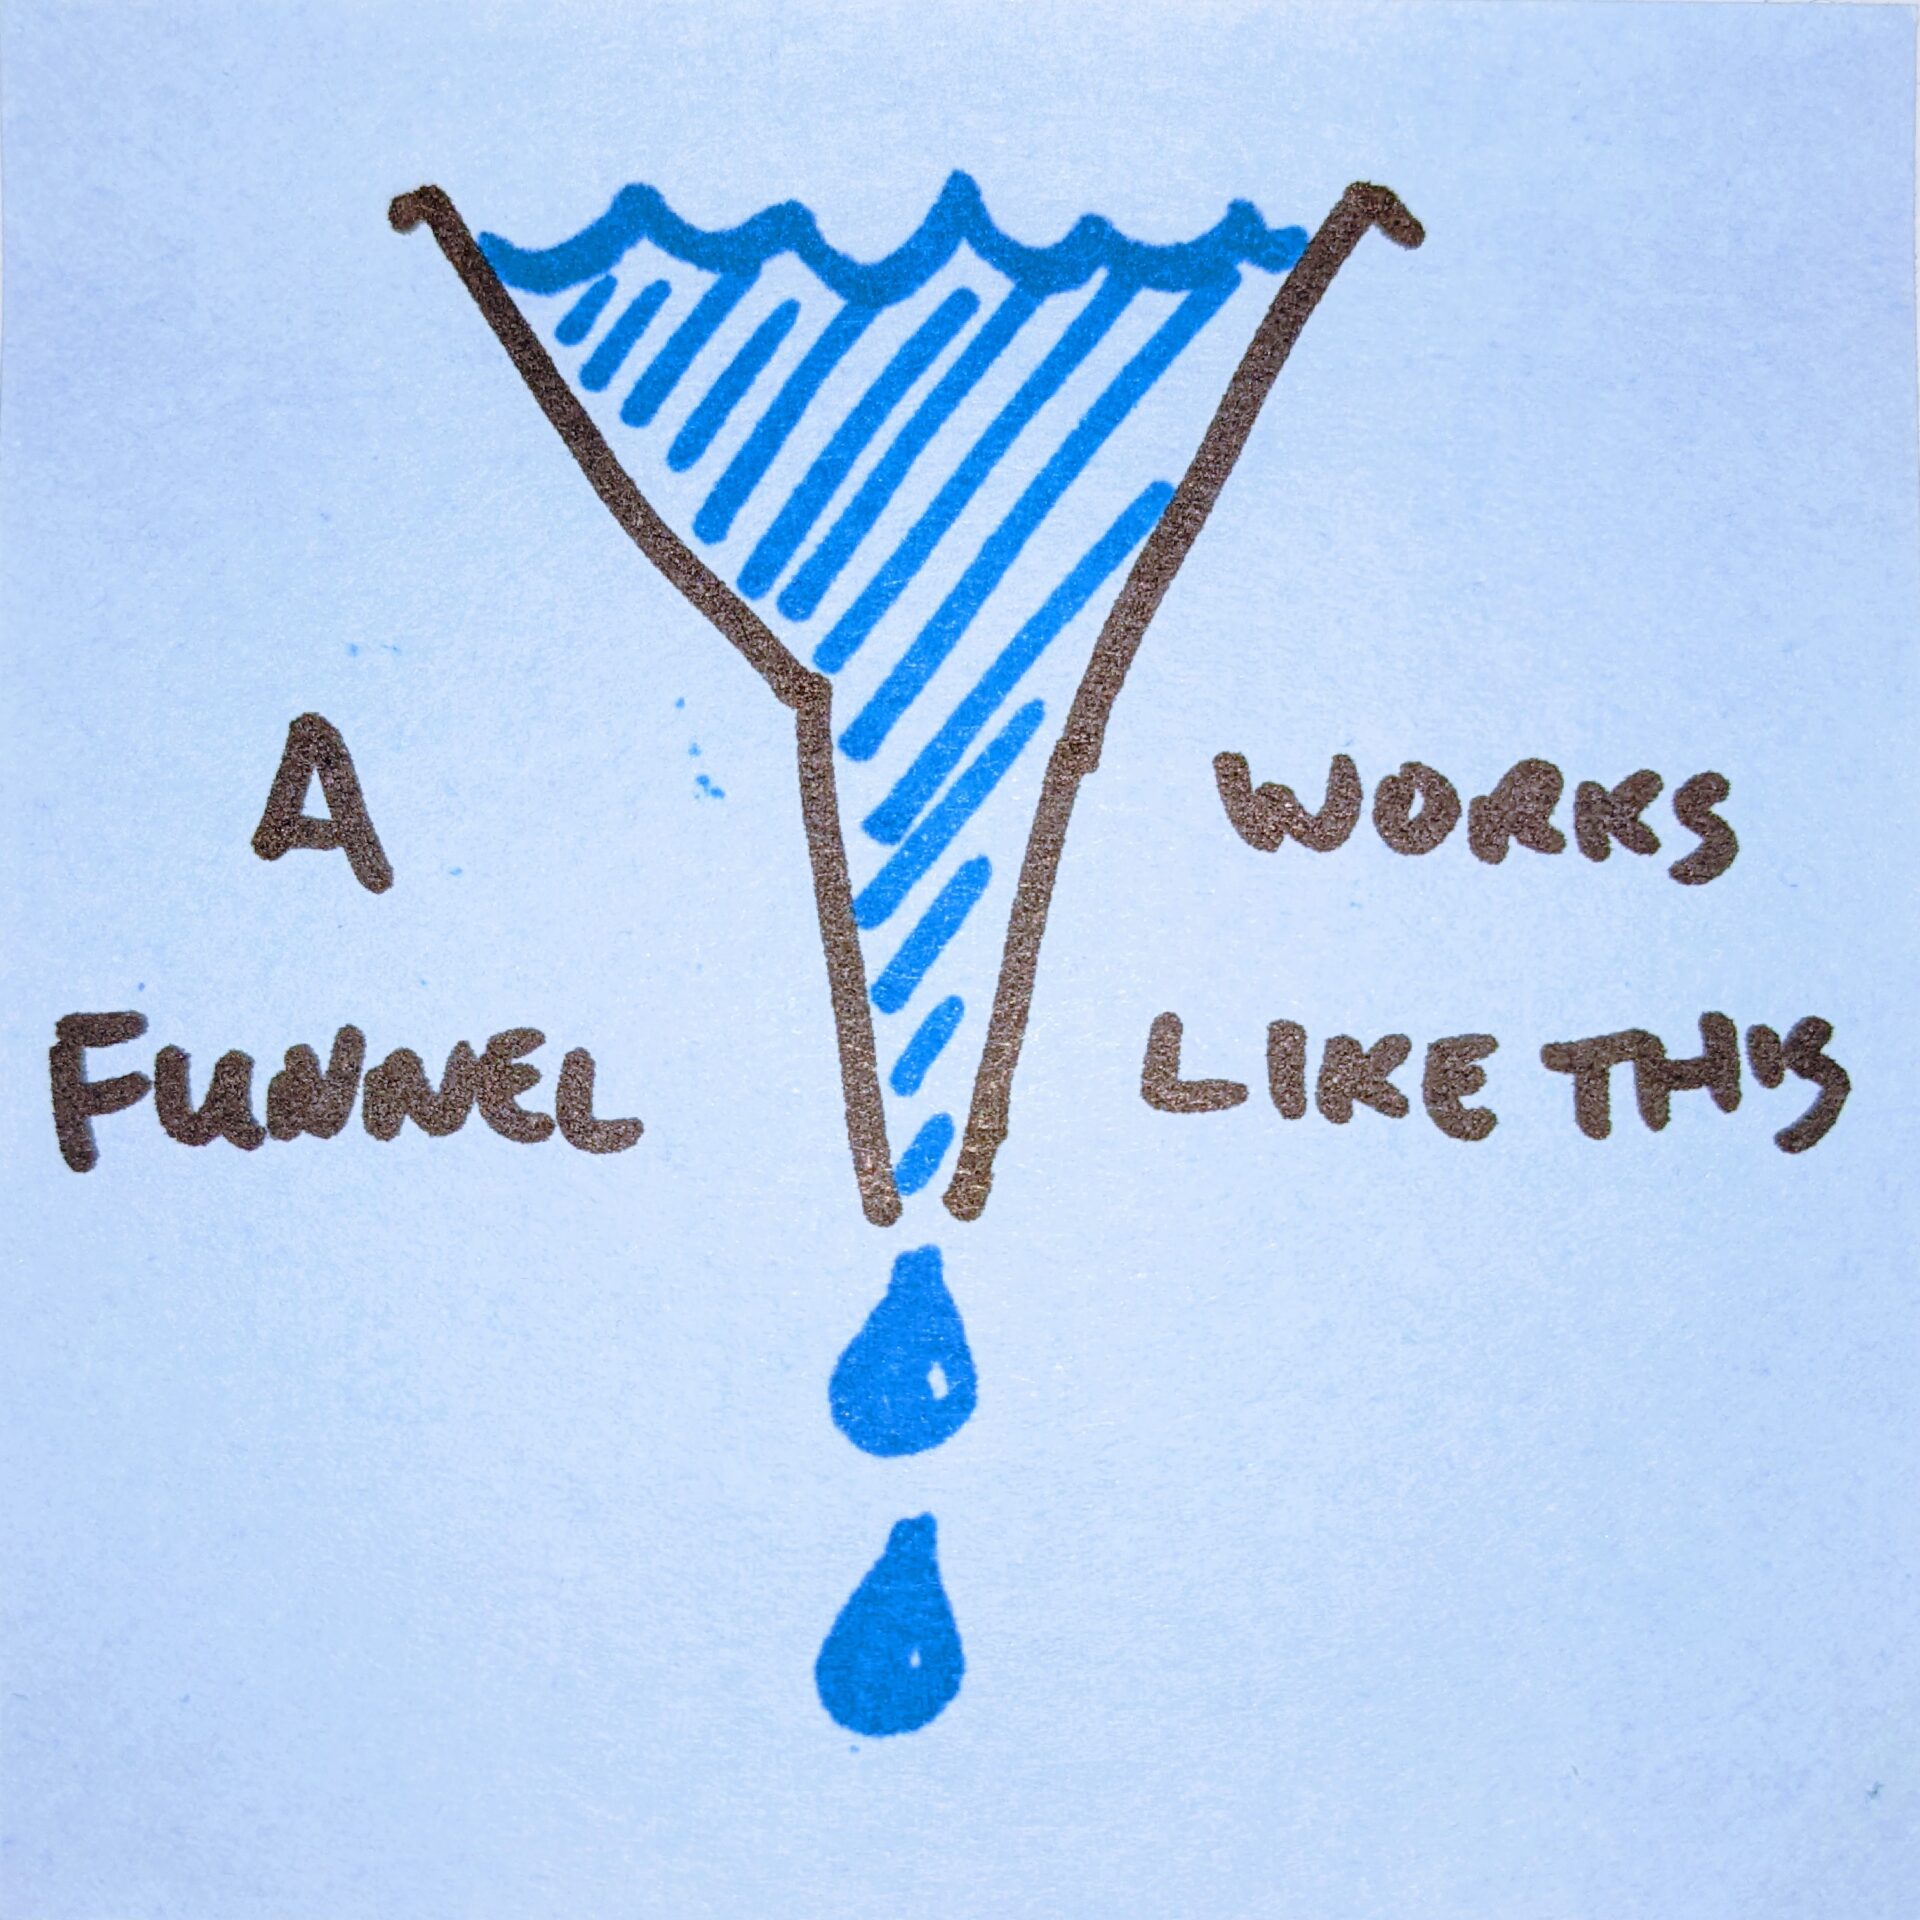
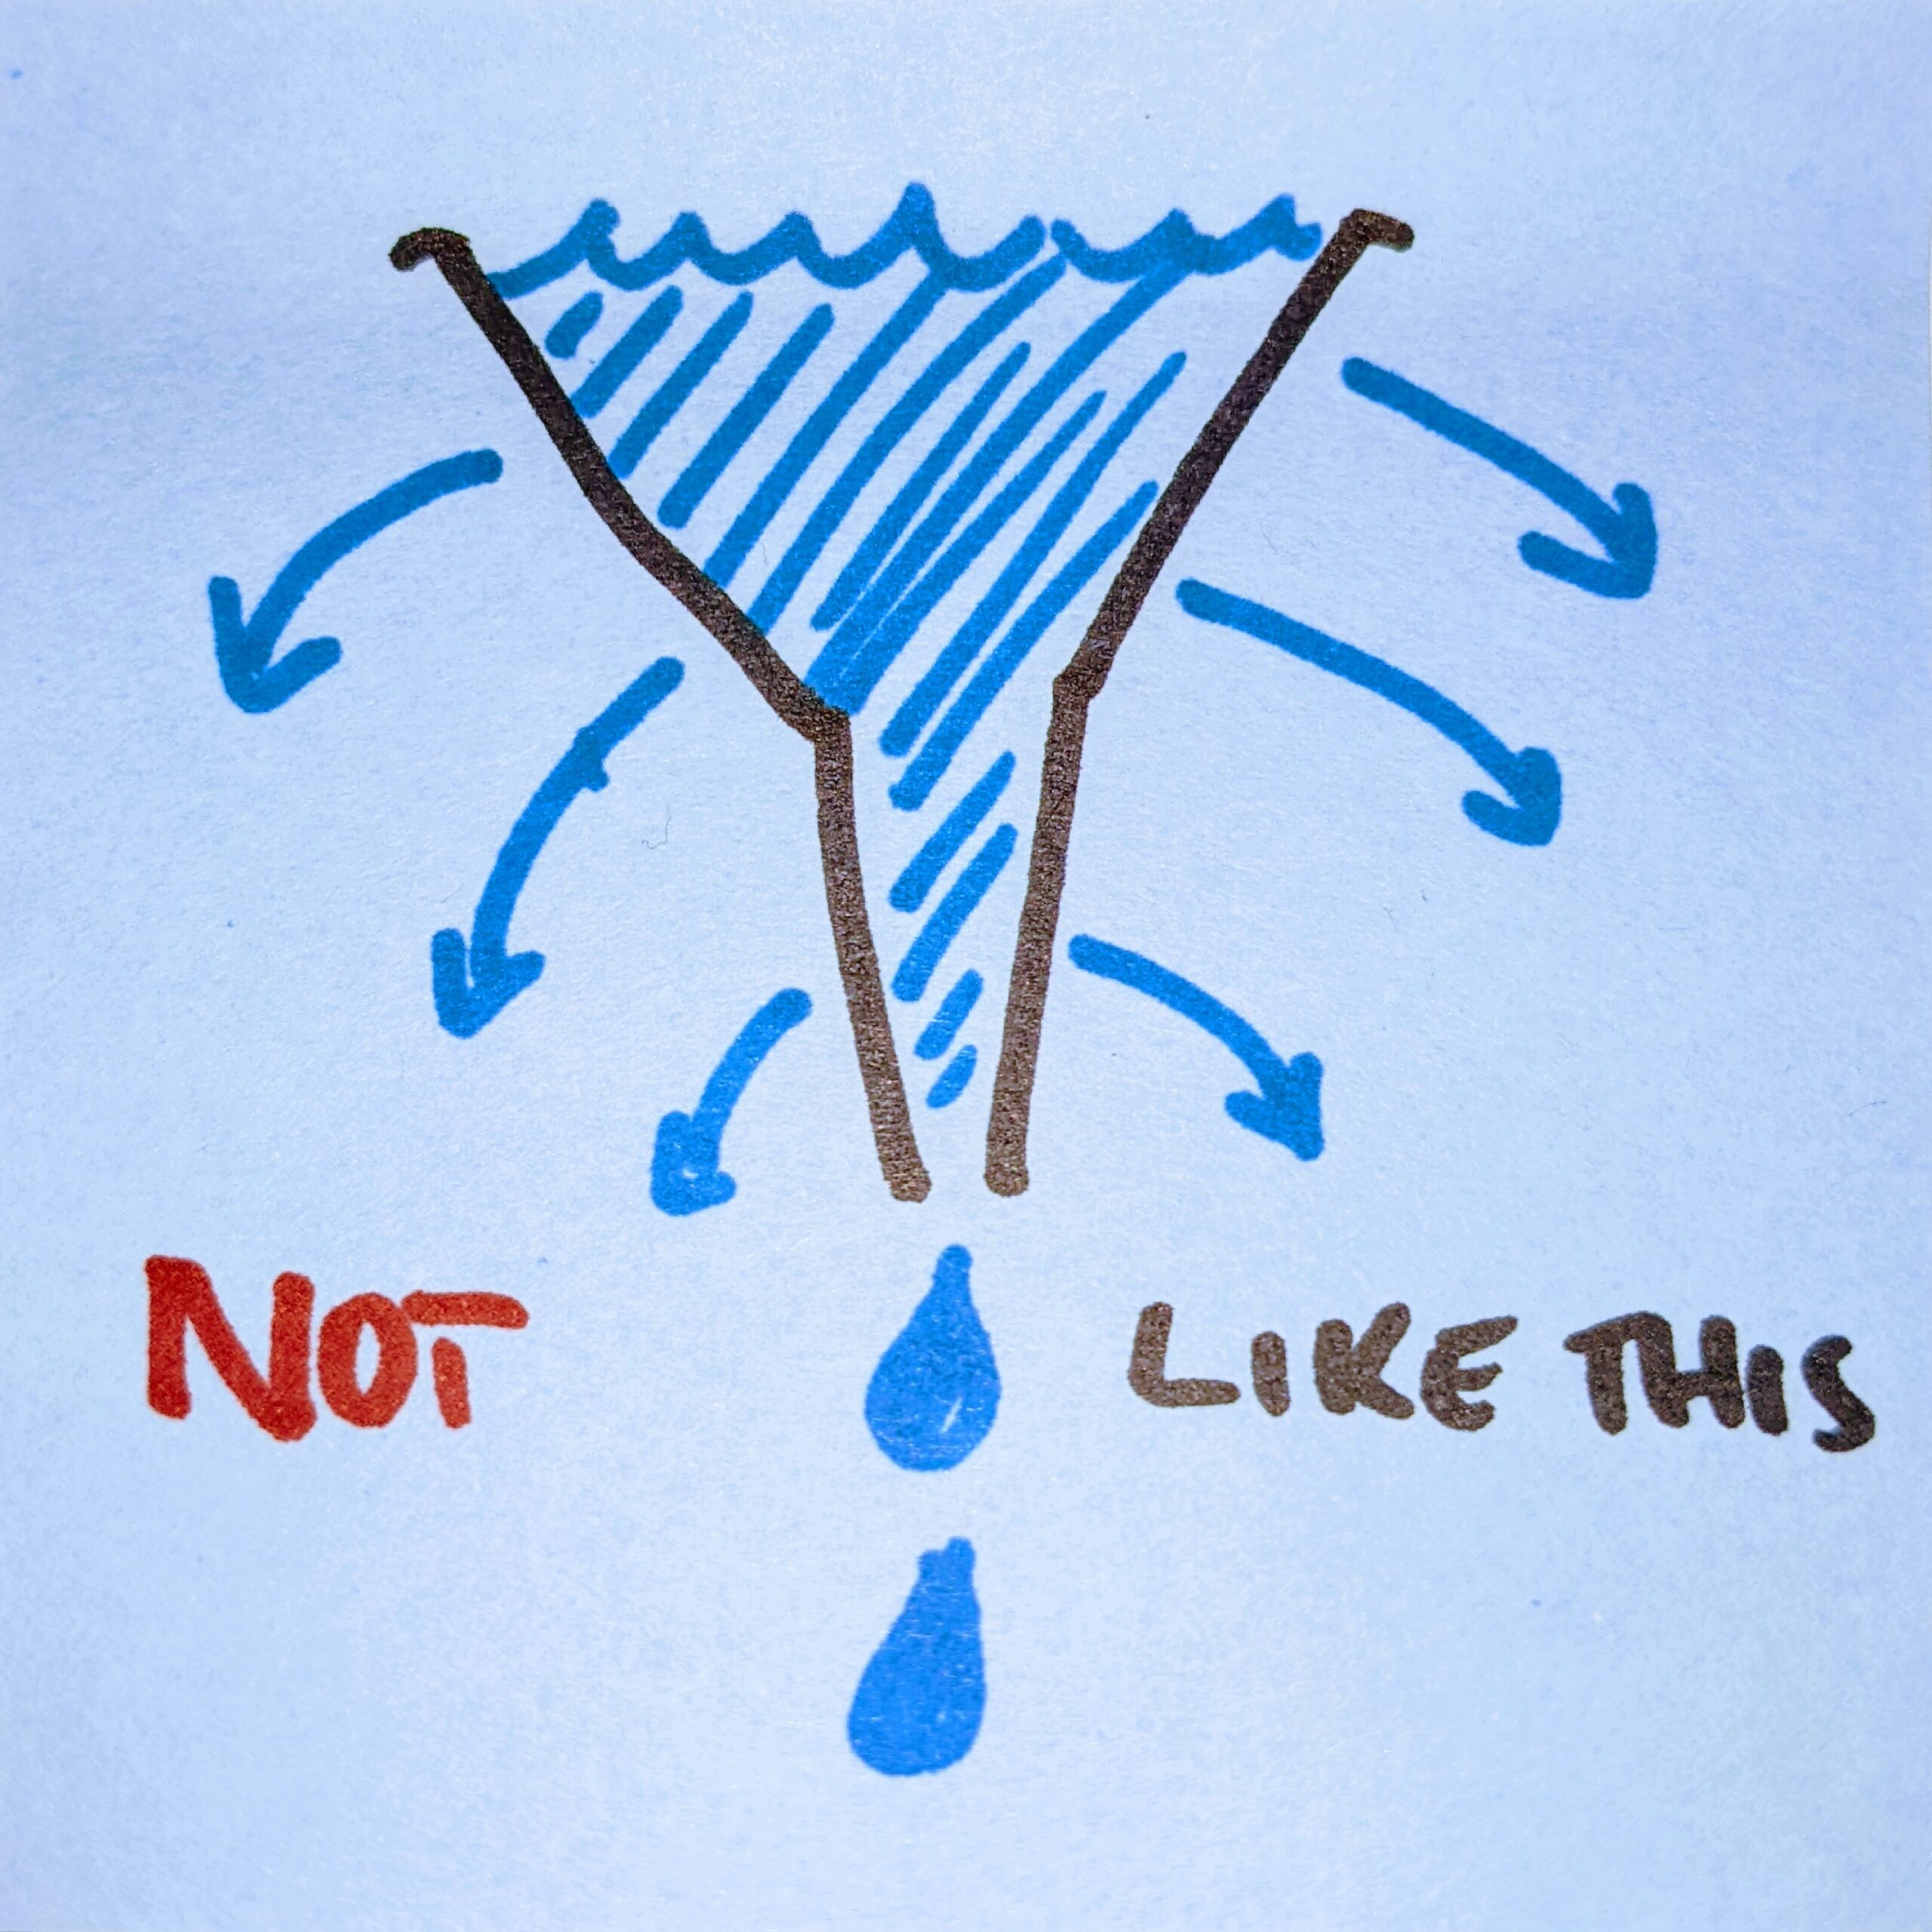
However, when you think about it, it’s a terrible visual metaphor because normally funnels help you to transfer 100% of what you put in the top to the spout. Maybe a series of finer-mesh sieves is a better way of thinking about it.
Conversion rates #
Aaaaaanyway, when thinking about conversion funnels and analytics, we measure the proportion of users that successfully move from one stage to another and call it the conversion rate.
So if 100 users downloaded your app, and then 75 of them successfully went on to create an account, your conversion rate for that stage is 75% (75/100). You’ll have a conversion rate for each stage. How you define the stages is entirely up to you.
Conversion rates help us to spot at which stages we’re losing more users than we’re expecting to. We can then start the process of figuring out why that’s happening and trying to do something about it.
What does normal look like? #
When trying to change a particular conversion rate, you need to have a sense of what ‘normal’ looks like – this is your baseline. If you don’t have the ability to measure your baseline, then that’s the first thing to work on. Otherwise you’ll never know whether you’re able to influence that conversion rate through the changes you’re making.
User segments #
If you were to go to your local municipal swimming pool, you might find that there are separate swimlanes for fast, medium and slow swimmers doing lengths of the pool. There might also be a separate area for kids to have a play and a splash around.

Imagine if all the different pool users were trying to share the same area of the swimming pool. It would be very noisy, chaotic and difficult to spot which users were trying to do what.
When you start to look at what your users are doing and why they’re doing it, you might start to see that certain groups of users behave differently to others. When we start to group together users by a behaviour or characteristic they have in common, we can think of them as a segment. The areas of the swimming pool reserved for different pool users are like segments: groups of people who are behaving in a similar way. We do something similar when we define user personas.
Grouping our users into segments lets us spot common patterns of behaviour more easily by filtering out the distracting noise created by other groups of users behaving differently. Segmenting our users also lets us compare the characteristics of one group with another.
Some of our app users might be super-keen and use it at least 5 times a day, every day. Another segment of our users might use it a lot on one day, then not use it for a few days before using it again. Yet another might have set up their account, but for some reason just don’t use the app at all. It’s natural to wonder why they’re doing that, and because you’ve identified the specific segment behaving in that way, you can focus your attention on just them.
Cohorts #
Another way of segmenting our users is by time. If we think back to our swimming pool example, the group of swimmers using the pool at 6am may behave a bit differently to the group at lunchtime, or to the crowd coming in for a swim after work.
When we group users by the time they first came to us, we call them cohorts. So for our app users, we might have a cohort for the users that downloaded the app in January, and another for February, and so on. We can still also divide up these cohorts into our segments if we like.
Cohorts help us to see whether the mix of behaviours changes over time, and whether earlier groups of users behave differently to more recent groups of users.
Final thoughts #
Hopefully this demystifies analytics a little for you. If you’re interested in finding out more, try some of the content I’ve gathered for you this week, and take a look at an earlier edition of PRODUCTHEAD on metrics.
Speak to you soon,
Jock
what to think about this week
Complete beginner’s guide to analytics
There’s no one magic way to create an experience that will be universally and automatically loved. That’s not the goal—rather, we seek to create experiences that will intuitively work for and delight a specific target audience. Similarly, there’s no one method for measuring the success of our creations. That’s where analytics comes in.
If you can’t measure it, how will you know if it was successful?
[UX BOOTH]
Lean Analytics
The core idea behind Lean Analytics is this: by knowing the kind of business you are, and the stage you’re at, you can track and optimize the One Metric That Matters to your startup right now.
Use data to build a better startup faster
[ALISTAIR CROLL & BEN YOSKOVITZ]
Death by ‘best practices’: why they can kill your business
We remodelled our registration based on what I thought was a marketing best practice. The number of registrations from anonymous visitors to signups skyrocketed. I was ecstatic as it was my first major marketing win.
Not really.
After a few weeks, we realized that the remodelled form didn’t bring more new customers. It only increased the amount of signups, but those signups were less qualified and less inclined to become customers.
We were back to square one.
Discover your own internal best practices
[LOUIS GRENIER / HOTJAR]
Making data actionable
Matthew discusses how Lovehoney focuses on the behaviours behind KPIs and metrics. In this video, he aims to save companies from the paralysis that ensues after trawling through too many KPIs and metrics, and instead advises us to drill down to the emotions and reasoning behind the data.
Insecure about the size of your data?
[MATTHEW CURRY / MIND THE PRODUCT]
recent posts
The agency trap
How can product management fit into an agency business model when requirements or specifications are often contractually set in stone by the client up-front? Spoiler alert: not easily
[I MANAGE PRODUCTS]
Whatever this is, this web3 product manager role is not a product manager
Jason Shah wrote a guest post recently for Lenny Rachitsky’s newsletter, “A Product Manager’s Guide to web3”, which describes how product management differs in web3 companies. He notes that joining a web3 company can be “an opaque process and a risky decision”. I’d add “ethically challenging and morally grey” to that description.
“You keep using that word. I do not think it means what you think it means.”
[I MANAGE PRODUCTS]
Sorting the signal from the noise — a guide to fact-checking
One of the most important, and arguably hardest jobs we have as product managers is to work with our team to sift through information, read between the lines, and verify what is fact and what is merely opinion.
[I MANAGE PRODUCTS]
upcoming talks and events
15th June 2022
Chief Product Officer Summit

We have the crème de la crème of product leadership events’ taking place on June 15, don’t miss out 🙅🏻♀️🙅🏻🙅🏽♂️
The FOMO will be real if you miss out on the amazing knowledge being shared by our renowned lineup of speakers.
Every single presentation gives you the opportunity to get instant feedback on your burning questions – directly from the experts.
Sign up and get ready to level up your product-led insight!
can we help you?
Product People is a product management services company. We can help you through consultancy, training and coaching. Just contact us if you need our help!
Helping people build better products, more successfully, since 2012.
PRODUCTHEAD is a newsletter for product people of all varieties, and is lovingly crafted from from some rather attractive workshop booklets, if I do say so myself.
Read more from Jock

The Practitioner's Guide To Product Management
by Jock Busuttil
“I wish this book was published when I started out in product management. It gives a really wonderful overview of what product management is and involves on a day to day basis.”
— Keji Adedeji, product leader & coach
Jock Busuttil is a product management and leadership coach, product leader and author. He has spent over two decades working with technology companies to improve their product management practices, from startups to multinationals. In 2012 Jock founded Product People Limited, which provides product management consultancy, coaching and training. Its clients include BBC, University of Cambridge, Ometria, Prolific and the UK’s Ministry of Justice and Government Digital Service (GDS). Jock holds a master’s degree in Classics from the University of Cambridge. He is the author of the popular book The Practitioner’s Guide To Product Management, which was published in January 2015 by Grand Central Publishing in the US and Piatkus in the UK. He writes the blog I Manage Products and weekly product management newsletter PRODUCTHEAD. You can find him on Mastodon, X (formerly Twitter) and LinkedIn.